TiDB-Binlog User Guide
This document describes how to deploy the Kafka version of TiDB-Binlog. If you need to deploy the local version of TiDB-Binlog, see the TiDB-Binlog user guide for the local version.
About TiDB-Binlog
TiDB-Binlog is a tool for enterprise users to collect binlog files for TiDB and provide real-time backup and synchronization.
TiDB-Binlog supports the following scenarios:
- Data synchronization: to synchronize TiDB cluster data to other databases
- Real-time backup and recovery: to back up TiDB cluster data, and recover in case of cluster outages
TiDB-Binlog architecture
The TiDB-Binlog architecture is as follows:
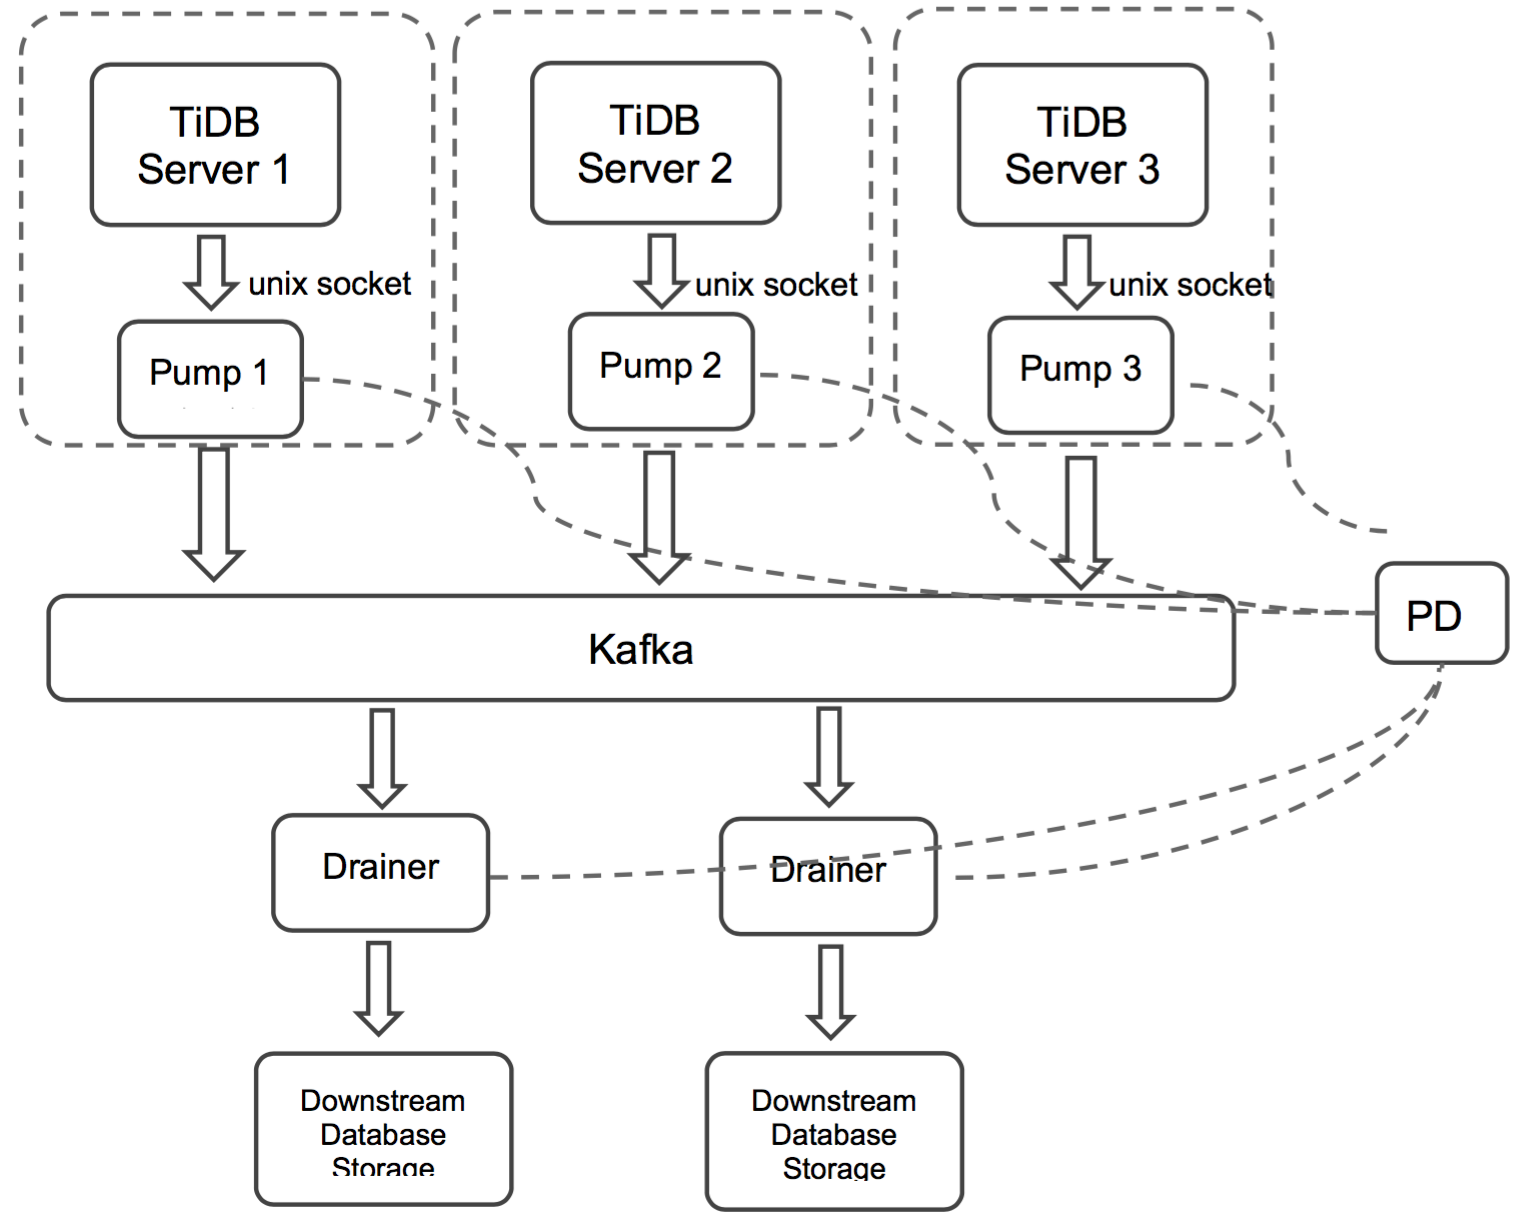
The TiDB-Binlog cluster mainly consists of three components:
Pump
Pump is a daemon that runs on the background of each TiDB host. Its main function is to record the binlog files generated by TiDB in real time and write to the file in the disk sequentially.
Drainer
Drainer collects binlog files from each Pump node, converts them into specified database-compatible SQL statements in the commit order of the transactions in TiDB, and synchronizes to the target database or writes to the file sequentially.
Kafka & ZooKeeper
The Kafka cluster stores the binlog data written by Pump and provides the binlog data to Drainer for reading.
Note: In the local version of TiDB-Binlog, the binlog is stored in files, while in the latest version, the binlog is stored using Kafka.
Install TiDB-Binlog
Download Binary for the CentOS 7.3+ platform
# Download the tool package.
wget http://download.pingcap.org/tidb-binlog-latest-linux-amd64.tar.gz
wget http://download.pingcap.org/tidb-binlog-latest-linux-amd64.sha256

# Check the file integrity. If the result is OK, the file is correct.
sha256sum -c tidb-binlog-latest-linux-amd64.sha256

# Extract the package.
tar -xzf tidb-binlog-latest-linux-amd64.tar.gz
cd tidb-binlog-latest-linux-amd64
Deploy TiDB-Binlog
Note
You need to deploy a Pump for each TiDB server in the TiDB cluster. Currently, the TiDB server only supports the binlog in UNIX socket.
When you deploy a Pump manually, to start the service, follow the order of Pump -> TiDB; to stop the service, follow the order of TiDB -> Pump.
We set the startup parameter
binlog-socketas the specified unix socket file path of the corresponding parametersocketin Pump. The final deployment architecture is as follows: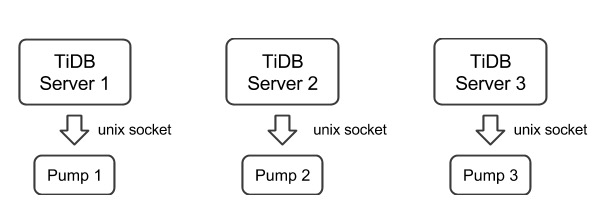
Drainer does not support renaming DDL on the table of the ignored schemas (schemas in the filter list).
To start Drainer in the existing TiDB cluster, usually you need to do a full backup, get the savepoint, import the full backup, and start Drainer and synchronize from the savepoint.
To guarantee the integrity of data, perform the following operations 10 minutes after Pump is started:
- Use binlogctl of the tidb-tools project to generate the
positionfor the initial start of Drainer. - Do a full backup. For example, back up TiDB using Mydumper.
- Import the full backup to the target system.
The savepoint metadata started by the Kafka version of Drainer is stored in the
checkpointtable of the downstream databasetidb_binlogby default. If no valid data exists in thecheckpointtable, configureinitial-commit-tsto make Drainer work from a specified position when it is started:bin/drainer --config=conf/drainer.toml --initial-commit-ts=${position}
- Use binlogctl of the tidb-tools project to generate the
The drainer outputs
pband you need to set the following parameters in the configuration file:[syncer] db-type = "pb" disable-dispatch = true [syncer.to] dir = "/path/pb-dir"
The drainer outputs
kafkaand you need to set the following parameters in the configuration file:[syncer] db-type = "kafka" # when db-type is kafka, you can uncomment this to config the down stream kafka, or it will be the same kafka addrs where drainer pulls binlog from. # [syncer.to] # kafka-addrs = "127.0.0.1:9092" # kafka-version = "0.8.2.0"The data which outputs to kafka follows the binlog format sorted by ts and defined by protobuf. See driver to access the data and sync to the down stream.
Deploy Kafka and ZooKeeper cluster before deploying TiDB-Binlog. Make sure that Kafka is 0.9 version or later.
Recommended Kafka cluster configuration
| Name | Number | Memory size | CPU | Hard disk |
|---|---|---|---|---|
| Kafka | 3+ | 16G | 8+ | 2+ 1TB |
| ZooKeeper | 3+ | 8G | 4+ | 2+ 300G |
Recommended Kafka parameter configuration
auto.create.topics.enable = true: if no topic exists, Kafka automatically creates a topic on the broker.broker.id: a required parameter to identify the Kafka cluster. Keep the parameter value unique. For example,broker.id = 1.fs.file-max = 1000000: Kafka uses a lot of files and network sockets. It is recommended to change the parameter value to 1000000. Change the value usingvi /etc/sysctl.conf.
Deploy Pump using TiDB-Ansible
- If you have not deployed the Kafka cluster, use the Kafka-Ansible to deploy.
- When you deploy the TiDB cluster using TiDB-Ansible, edit the
tidb-ansible/inventory.inifile, setenable_binlog = True, and configure thezookeeper_addrsvariable as the ZooKeeper address of the Kafka cluster. In this way, Pump is deployed while you deploy the TiDB cluster.
Configuration example:
# binlog trigger
enable_binlog = True
# ZooKeeper address of the Kafka cluster. Example:
# zookeeper_addrs = "192.168.0.11:2181,192.168.0.12:2181,192.168.0.13:2181"
# You can also append an optional chroot string to the URLs to specify the root directory for all Kafka znodes. Example:
# zookeeper_addrs = "192.168.0.11:2181,192.168.0.12:2181,192.168.0.13:2181/kafka/123"
zookeeper_addrs = "192.168.0.11:2181,192.168.0.12:2181,192.168.0.13:2181"
Deploy Pump using Binary
A usage example:
Assume that we have three PDs, three ZooKeepers, and one TiDB. The information of each node is as follows:
TiDB="192.168.0.10"
PD1="192.168.0.16"
PD2="192.168.0.15"
PD3="192.168.0.14"
ZK1="192.168.0.13"
ZK2="192.168.0.12"
ZK3="192.168.0.11"
Deploy Drainer/Pump on the machine with the IP address “192.168.0.10”.
The IP address of the corresponding PD cluster is “192.168.0.16,192.168.0.15,192.168.0.14”.
The ZooKeeper IP address of the corresponding Kafka cluster is “192.168.0.13,192.168.0.12,192.168.0.11”.
This example describes how to use Pump/Drainer.
Description of Pump command line options
Usage of Pump:
-L string
    log level: debug, info, warn, error, fatal (default "info")
-V
    to print Pump version info
-addr string
    the RPC address that Pump provides service (-addr= "192.168.0.10:8250")
-advertise-addr string
    the RPC address that Pump provides external service (-advertise-addr="192.168.0.10:8250")
-config string
    to configure the file path of Pump; if you specifies the configuration file, Pump reads the configuration first; if the corresponding configuration also exists in the command line argument, Pump uses the command line configuration to cover that in the configuration file
-data-dir string
    the path of storing Pump data
-enable-tolerant
    after enabling tolerant, Pump wouldn't return error if it fails to write binlog (default true)
-zookeeper-addrs string (-zookeeper_addrs="192.168.0.11:2181,192.168.0.12:2181,192.168.0.13:2181")
    the ZooKeeper address; this option gets the Kafka address from ZooKeeper, and you need to keep it the same with the configuration in Kafka
-gc int
    the maximum days that the binlog is retained (default 7), and 0 means retaining the binlog permanently
-heartbeat-interval int
    the interval between heartbeats that Pump sends to PD (unit: second)
-log-file string
    the path of the log file
-log-rotate string
    the log file rotating frequency (hour/day)
-metrics-addr string
    the Prometheus pushgateway address; leaving it empty disables Prometheus push
-metrics-interval int
    the frequency of reporting monitoring information (default 15, unit: second)
-pd-urls string
    the node address of the PD cluster (-pd-urls="http://192.168.0.16:2379,http://192.168.0.15:2379,http://192.168.0.14:2379")
-socket string
    the monitoring address of the unix socket service (default "unix:///tmp/pump.sock")
Pump configuration file
# Pump configuration.
# the RPC address that Pump provides service (default "192.168.0.10:8250")
addr = "192.168.0.10:8250"

# the RPC address that Pump provides external service (default "192.168.0.10:8250")
advertise-addr = ""

# an integer value to control expiry date of the binlog data, indicates how long (in days) the binlog data is stored.
# (default value is 0, means binlog data would never be removed)
gc = 7

# the path of storing Pump data
data-dir = "data.pump"

# the ZooKeeper address; You can set the option to get the Kafka address from ZooKeeper; if the namespace is configured in Kafka, you need to keep the same configuration here
zookeeper-addrs = "192.168.0.11:2181,192.168.0.12:2181,192.168.0.13:2181"
# example of the ZooKeeper address that configures the namespace
zookeeper-addrs = "192.168.0.11:2181,192.168.0.12:2181,192.168.0.13:2181/kafka/123"

# the interval between heartbeats that Pump sends to PD (unit: second)
heartbeat-interval = 3

# the node address of the PD cluster
pd-urls = "http://192.168.0.16:2379,http://192.168.0.15:2379,http://192.168.0.14:2379"

# the monitoring address of the unix socket service (default "unix:///tmp/pump.sock")
socket = "unix:///tmp/pump.sock"
Startup example
./bin/pump -config pump.toml
Deploy Drainer using Binary
Description of Drainer command line arguments
Usage of Drainer:
-L string
    log level: debug, info, warn, error, fatal (default "info")
-V
    to print Pump version info
-addr string
    the address that Drainer provides service (default "192.168.0.10:8249")
-c int
    to synchronize the downstream concurrency number, and a bigger value means better throughput performance (default 1)
-config string
    to configure the file path of Drainer; if you specifies the configuration file, Drainer reads the configuration first; if the corresponding configuration also exists in the command line argument, Pump uses the command line configuration to cover that in the configuration file
-data-dir string
    the path of storing Drainer data (default "data.drainer")
-zookeeper-addrs string (-zookeeper-addrs="192.168.0.11:2181,192.168.0.12:2181,192.168.0.13:2181")
    the ZooKeeper address; you can set this option to get the Kafka address from ZooKeeper, and you need to keep it the same with the configuration in Kafka
-dest-db-type string
    the downstream service type of Drainer (default "mysql")
-detect-interval int
    the interval of detecting Pump's status from PD (default 10, unit: second)
-disable-dispatch
    whether to disable dispatching sqls in a single binlog; if you set the value to true, it is restored into a single transaction to synchronize in the order of each binlog (If the downstream service type is "mysql", set the value to false)
-ignore-schemas string
    the DB filtering list (default "INFORMATION_SCHEMA,PERFORMANCE_SCHEMA,mysql,test"); does not support the rename DDL operation on the table of ignore schemas
-initial-commit-ts (default 0)
    If Drainer does not provide related breakpoint information, you can use this option to configure the related breakpoint information
-log-file string
    the path of the log file
-log-rotate string
    the log file rotating frequency (hour/day)
-metrics-addr string
    the Prometheus pushgateway address; leaving it empty disables Prometheus push
-metrics-interval int
    the frequency of reporting monitoring information (default 15, unit: second)
-pd-urls string
    the node address of the PD cluster (-pd-urls="http://192.168.0.16:2379,http://192.168.0.15:2379,http://192.168.0.14:2379")
-txn-batch int
    the number of SQL statements in a single transaction that is output to the downstream database (default 1)
Drainer configuration file
# Drainer configuration

# the address that Drainer provides service ("192.168.0.10:8249")
addr = "192.168.0.10:8249"

# the interval of detecting Pump's status from PD (default 10, unit: second)
detect-interval = 10

# the path of storing Drainer data (default "data.drainer")
data-dir = "data.drainer"

# the ZooKeeper address; you can use this option to get the Kafka address from ZooKeeper; if the namespace is configured in Kafka, you need to keep the same configuration here
zookeeper-addrs = "192.168.0.11:2181,192.168.0.12:2181,192.168.0.13:2181"
# example of the ZooKeeper address that configures the namespace
zookeeper-addrs = "192.168.0.11:2181,192.168.0.12:2181,192.168.0.13:2181/kafka/123"

# the node address of the PD cluster
pd-urls = "http://192.168.0.16:2379,http://192.168.0.15:2379,http://192.168.0.14:2379"

# the path of the log file
log-file = "drainer.log"

# Syncer configuration.
[syncer]

# the DB filtering list (default "INFORMATION_SCHEMA,PERFORMANCE_SCHEMA,mysql,test")
# does not support the rename DDL operation on the table of ignore schemas
ignore-schemas = "INFORMATION_SCHEMA,PERFORMANCE_SCHEMA,mysql"

# the number of SQL statements in a single transaction that is output to the downstream database (default 1)
txn-batch = 1

# to synchronize the downstream concurrency number, and a bigger value means better throughput performance (default 1)
worker-count = 1

# whether to disable dispatching sqls in a single binlog;
# if you set the value to true, it is restored into a single transaction to synchronize in the order of each binlog (If the downstream service type is "mysql", set the value to false)
disable-dispatch = false

# the downstream service type of Drainer (default "mysql")
# valid values: "mysql", "pb"
db-type = "mysql"

# replicate-do-db priority over replicate-do-table if have same db name
# and we support regex expression,
# the regex expression starts with '~'

# replicate-do-db = ["~^b.*","s1"]

# [[syncer.replicate-do-table]]
# db-name ="test"
# tbl-name = "log"

# [[syncer.replicate-do-table]]
# db-name ="test"
# tbl-name = "~^a.*"

# server parameters of the downstream database when the db-type is set to "mysql"
[syncer.to]
host = "192.168.0.10"
user = "root"
password = ""
port = 3306

# the directory of the binlog file when the db-type is set to "pb"
# [syncer.to]
# dir = "data.drainer"
Startup example
./bin/drainer -config drainer.toml
Download PbReader (Linux)
PbReader parses the pb file generated by Drainer and translates it into SQL statements.
CentOS 7+
# Download PbReader package
wget http://download.pingcap.org/pb_reader-latest-linux-amd64.tar.gz
wget http://download.pingcap.org/pb_reader-latest-linux-amd64.sha256

# Check the file integrity. If the result is OK, the file is correct.
sha256sum -c pb_reader-latest-linux-amd64.sha256

# Extract the package.
tar -xzf pb_reader-latest-linux-amd64.tar.gz
cd pb_reader-latest-linux-amd64
The PbReader usage example
./bin/pbReader -binlog-file=${path}/binlog-0000000000000000Monitor TiDB-Binlog
This section introduces how to monitor TiDB-Binlog’s status and performance, and display the metrics using Prometheus and Grafana.
Configure Pump/Drainer
Use the Pump service deployed using Ansible. Set metrics in startup parameters.
When you start Drainer, set the two parameters of --metrics-addr and --metrics-interval. Set --metrics-addr as the address of Push Gateway. Set --metrics-interval as the frequency of push (default 15 seconds).
Configure Grafana
Create a Prometheus data source
Login the Grafana Web interface.
The default address is: http://localhost:3000
The default account name: admin
The password for the default account: admin
Click the Grafana logo to open the sidebar menu.
Click “Data Sources” in the sidebar.
Click “Add data source”.
Specify the data source information:
- Specify the name for the data source.
- For Type, select Prometheus.
- For Url, specify the Prometheus address.
- Specify other fields as needed.
Click “Add” to save the new data source.
Create a Grafana dashboard
Click the Grafana logo to open the sidebar menu.
On the sidebar menu, click “Dashboards” -> “Import” to open the “Import Dashboard” window.
Click “Upload .json File” to upload a JSON file (Download TiDB Grafana Config).
Click “Save & Open”. A Prometheus dashboard is created.