Utility Statements
This document describes the utility statements, including the DESCRIBE, EXPLAIN, and USE statements.
DESCRIBE statement
The DESCRIBE and EXPLAIN statements are synonyms, which can also be abbreviated as DESC. See the usage of the EXPLAIN statement.
EXPLAIN statement
{EXPLAIN | DESCRIBE | DESC}
    tbl_name [col_name]

{EXPLAIN | DESCRIBE | DESC}
    [explain_type]
    explainable_stmt

explain_type:
    FORMAT = format_name

format_name:
    "DOT"

explainable_stmt: {
    SELECT statement
  | DELETE statement
  | INSERT statement
  | REPLACE statement
  | UPDATE statement
}
For more information about the EXPLAIN statement, see Understand the Query Execution Plan.
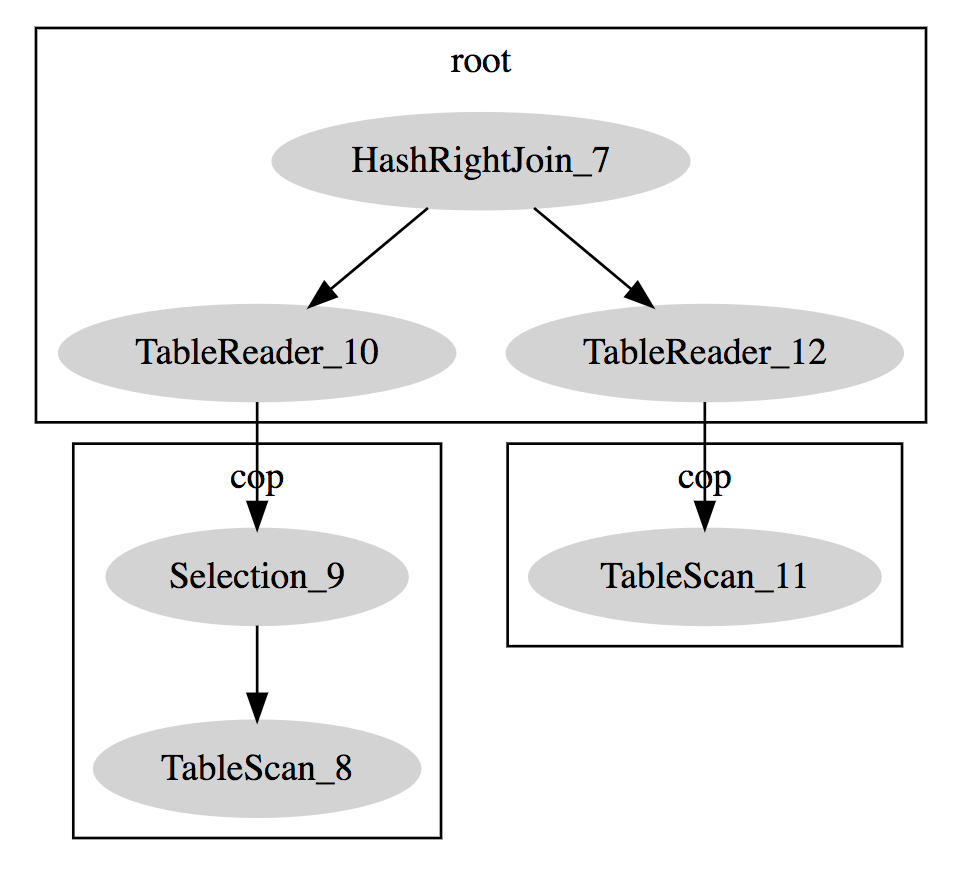
In addition to the MySQL standard result format, TiDB also supports DotGraph and you need to specify FORMAT = "dot" as in the following example:
create table t(a bigint, b bigint);
desc format = "dot" select A.a, B.b from t A join t B on A.a > B.b where A.a < 10;

TiDB > desc format = "dot" select A.a, B.b from t A join t B on A.a > B.b where A.a < 10;desc format = "dot" select A.a, B.b from t A join t B on A.a > B.b where A.a < 10;
+--------------------------------------------------------------------------------------------------------------------------------------------------------------------------------------------------------------------------------------------------------------------------------------------------------------------------------------------------------------------------------------------------------------------------------------------------------------------------------------------+
| dot contents                                                                                                                                                                                                                                                                                                                                                                                                                                                                               |
+--------------------------------------------------------------------------------------------------------------------------------------------------------------------------------------------------------------------------------------------------------------------------------------------------------------------------------------------------------------------------------------------------------------------------------------------------------------------------------------------+
|
digraph HashRightJoin_7 {
subgraph cluster7{
node [style=filled, color=lightgrey]
color=black
label = "root"
"HashRightJoin_7" -> "TableReader_10"
"HashRightJoin_7" -> "TableReader_12"
}
subgraph cluster9{
node [style=filled, color=lightgrey]
color=black
label = "cop"
"Selection_9" -> "TableScan_8"
}
subgraph cluster11{
node [style=filled, color=lightgrey]
color=black
label = "cop"
"TableScan_11"
}
"TableReader_10" -> "Selection_9"
"TableReader_12" -> "TableScan_11"
}
 |
+--------------------------------------------------------------------------------------------------------------------------------------------------------------------------------------------------------------------------------------------------------------------------------------------------------------------------------------------------------------------------------------------------------------------------------------------------------------------------------------------+
1 row in set (0.00 sec)
If the dot program (in the graphviz package) is installed on your computer, you can generate a PNG file using the following method:
dot xx.dot -T png -O

The xx.dot is the result returned by the above statement.
If the dot program is not installed on your computer, copy the result to this website to get a tree diagram:
USE statement
USE db_nameThe USE statement is used to switch the default database. If the table in SQL statements does not display the specified database, then use the default database.