Overview of the Monitoring Framework
The TiDB monitoring framework adopts two open source projects: Prometheus and Grafana. TiDB uses Prometheus to store the monitoring and performance metrics and Grafana to visualize these metrics.
About Prometheus in TiDB
As a time series database, Prometheus has a multi-dimensional data model and flexible query language. As one of the most popular open source projects, many companies and organizations have adopted Prometheus, and the project has a very active community. PingCAP is one of the active developers and adopters of Prometheus for monitoring and alerting in TiDB, TiKV and PD.
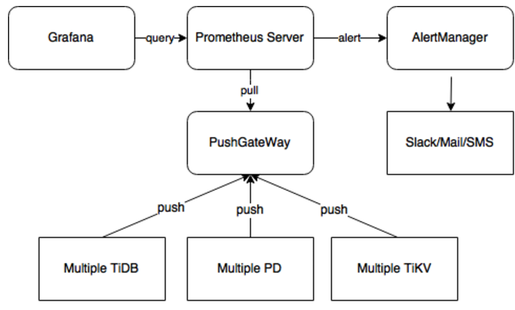
Prometheus consists of multiple components. Currently, TiDB uses the following of them:
- The Prometheus Server to scrape and store time series data.
- The client libraries to customize necessary metrics in the application.
- A push GateWay to receive the data from Client Push for the Prometheus main server.
- An AlertManager for the alerting mechanism.
The diagram is as follows:
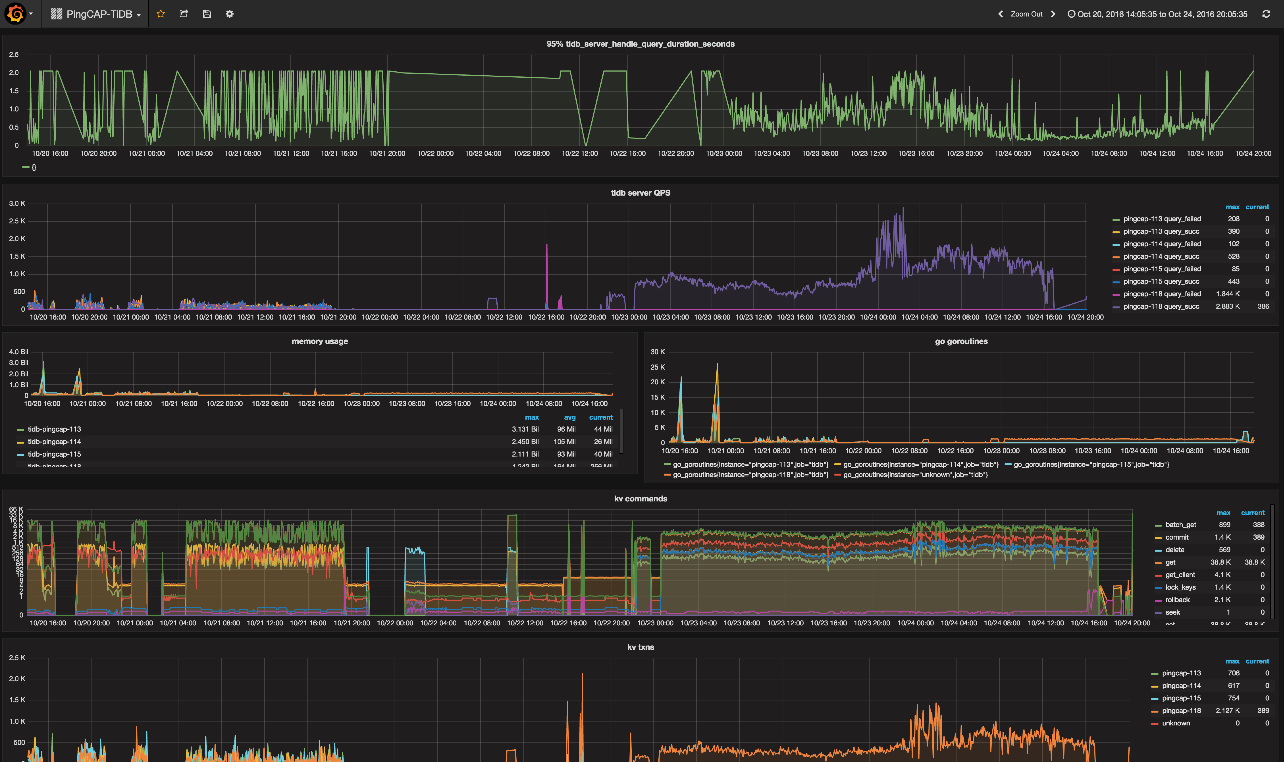
About Grafana in TiDB
Grafana is an open source project for analyzing and visualizing metrics. TiDB uses Grafana to display the performance metrics as follows: