Monitor a TiDB Cluster
Currently there are two types of interfaces to monitor the state of the TiDB cluster:
- Using the HTTP interface to get the internal information of a component, which is called the component state interface.
- Using Prometheus to record the detailed information of the various operations in the components, which is called the Metrics interface.
The component state interface
You can use this type of interface to monitor the basic information of the component. This interface can act as the interface to monitor Keepalive. In addition, the interface of the Placement Driver (PD) can get the details of the entire TiKV cluster.
TiDB server
The HTTP interface of TiDB is: http://host:port/status
The default port number is: 10080 which can be set using the --status flag.
The interface can be used to get the current TiDB server state and to determine whether the server is alive. The result is returned in the following JSON format:
curl http://127.0.0.1:10080/status
{
    connections: 0,
    version: "5.5.31-TiDB-1.0",
    git_hash: "b99521846ff6f71f06e2d49a3f98fa1c1d93d91b"
}
In this example,
- connection: the current number of clients connected to the TiDB server
- version: the TiDB version number
- git_hash: the Git Hash of the current TiDB code
PD server
The API address of PD is: http://${host}:${port}/pd/api/v1/${api_name}
The default port number is: 2379.
See PD API doc for detailed information about various API names.
The interface can be used to get the state of all the TiKV servers and the information about load balancing. It is the most important and frequently-used interface to get the state information of all the TiKV nodes. See the following example for the information about a single-node TiKV cluster:
curl http://127.0.0.1:2379/pd/api/v1/stores
{
  "count": 1 // the number of the TiKV node
  "stores": [  // the list of the TiKV node
  // the detailed information about the single TiKV node
  {
      "store": {
        "id": 1,
        "address": "127.0.0.1:22161",
        "state": 0
      },
      "status": {
        "store_id": 1,               // the ID of the node
        "capacity": 1968874332160,   // the total capacity
        "available": 1264847716352,  // the available capacity
        "region_count": 1,           // the count of Regions in this node
        "sending_snap_count": 0,
        "receiving_snap_count": 0,
        "start_ts": "2016-10-24T19:54:00.110728339+08:00",   // the starting timestamp
        "last_heartbeat_ts": "2016-10-25T10:52:54.973669928+08:00",   // the timestamp of the last heartbeat
        "total_region_count": 1,           // the count of the total Regions
        "leader_region_count": 1,        // the count of the Leader Regions
        "uptime": "14h58m54.862941589s"
      },
      "scores": [
        100,
        35
      ]
    }
  ]
}
The metrics interface
You can use this type of interface to monitor the state and performance of the entire cluster. The metrics data is displayed in Prometheus and Grafana. See Use Prometheus and Grafana for how to set up the monitoring system.
You can get the following metrics for each component:
TiDB server
query processing time to monitor the latency and throughput
the DDL process monitoring
TiKV client related monitoring
PD client related monitoring
PD server
the total number of times that the command executes
the total number of times that a certain command fails
the duration that a command succeeds
the duration that a command fails
the duration that a command finishes and returns result
TiKV server
Garbage Collection (GC) monitoring
the total number of times that the TiKV command executes
the duration that Scheduler executes commands
the total number of times of the Raft propose command
the duration that Raft executes commands
the total number of times that Raft commands fail
the total number of times that Raft processes the ready state
Use Prometheus and Grafana
The deployment architecture
See the following diagram for the deployment architecture:
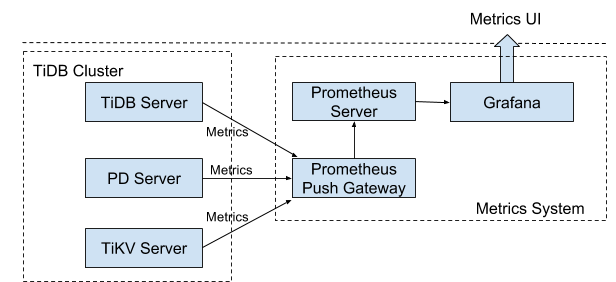
Note: You must add the Prometheus Pushgateway addresses to the startup parameters of the TiDB, PD and TiKV components.
Set up the monitoring system
See the following links for your reference:
Prometheus Push Gateway: https://github.com/prometheus/pushgateway
Prometheus Server: https://github.com/prometheus/prometheus#install
Grafana: http://docs.grafana.org
Configuration
Configure TiDB, PD and TiKV
TiDB: Set the two parameters:
--metrics-addrand--metrics-interval.- Set the Push Gateway address as the
--metrics-addrparameter. - Set the push frequency as the
--metrics-intervalparameter. The unit is s, and the default value is 15.
- Set the Push Gateway address as the
PD: update the toml configuration file with the Push Gateway address and the push frequency:
[metric]
# prometheus client push interval, set "0s" to disable prometheus.
interval = "15s"
# prometheus pushgateway address, leaves it empty will disable prometheus.
address = "host:port"
TiKV: update the toml configuration file with the Push Gateway address and the the push frequency. Set the job field as “tikv”.
[metric]
# the Prometheus client push interval. Setting the value to 0s stops Prometheus client from pushing.
interval = "15s"
# the Prometheus pushgateway address. Leaving it empty stops Prometheus client from pushing.
address = "host:port"
# the Prometheus client push job name. Note: A node id will automatically append, e.g., "tikv_1".
job = "tikv"
Configure PushServer
Generally, it does not need to be configured. You can use the default port: 9091.
Configure Prometheus
Add the Push Gateway address to the yaml configuration file:
 scrape_configs:
# The job name is added as a label `job=<job_name>` to any timeseries scraped from this config.
- job_name: 'TiDB'

  # Override the global default and scrape targets from this job every 5 seconds.
  scrape_interval: 5s

  honor_labels: true

  static_configs:
 - targets: ['host:port'] # use the Push Gateway address
labels:
  group: 'production'
Configure Grafana
Create a Prometheus data source
Login the Grafana Web interface.
The default address is: http://localhost:3000
The default account name: admin
The password for the default account: admin
Click the Grafana logo to open the sidebar menu.
Click “Data Sources” in the sidebar.
Click “Add data source”.
Specify the data source information:
Specify the name for the data source.
For Type, select Prometheus.
For Url, specify the Prometheus address.
Specify other fields as needed.
Click “Add” to save the new data source.
Create a Grafana dashboard
Click the Grafana logo to open the sidebar menu.
On the sidebar menu, click “Dashboards” -> “Import” to open the “Import Dashboard” window.
Click “Upload .json File” to upload a JSON file ( Download TiDB Grafana Config ).
Click “Save & Open”.
A Prometheus dashboard is created.